

Introduction:
Hired as an Analytics consultant by citi bike data to determine citi bike usage during the week , and to determine ways to increase bike usage.
This comprehensive analysis provides an in-depth understanding of bike usage in terms of types of consumers, time of the year and area in use. With a strategic roadmap, citi bike can improve their customer base as well as exapnd to new locations.
The full interactive Tableau Dashboard can be found Here
Business Questions
- What type of customer should we target, and what are their preferences?
- What are the most popular pick-up locations across the city for Citi Bike rental?
- What types of bikes should we offer?
- How can we align prices with customer value perception?
About the data
Bike rentals during the year of 2019 and 2020 were combined into one. Data consists of 1 table consisting of 14 fields and 288443 records in csv format.
Tools Used
Excel (Data Cleaning)
Tableau (Exploration & Visualization)
Insights
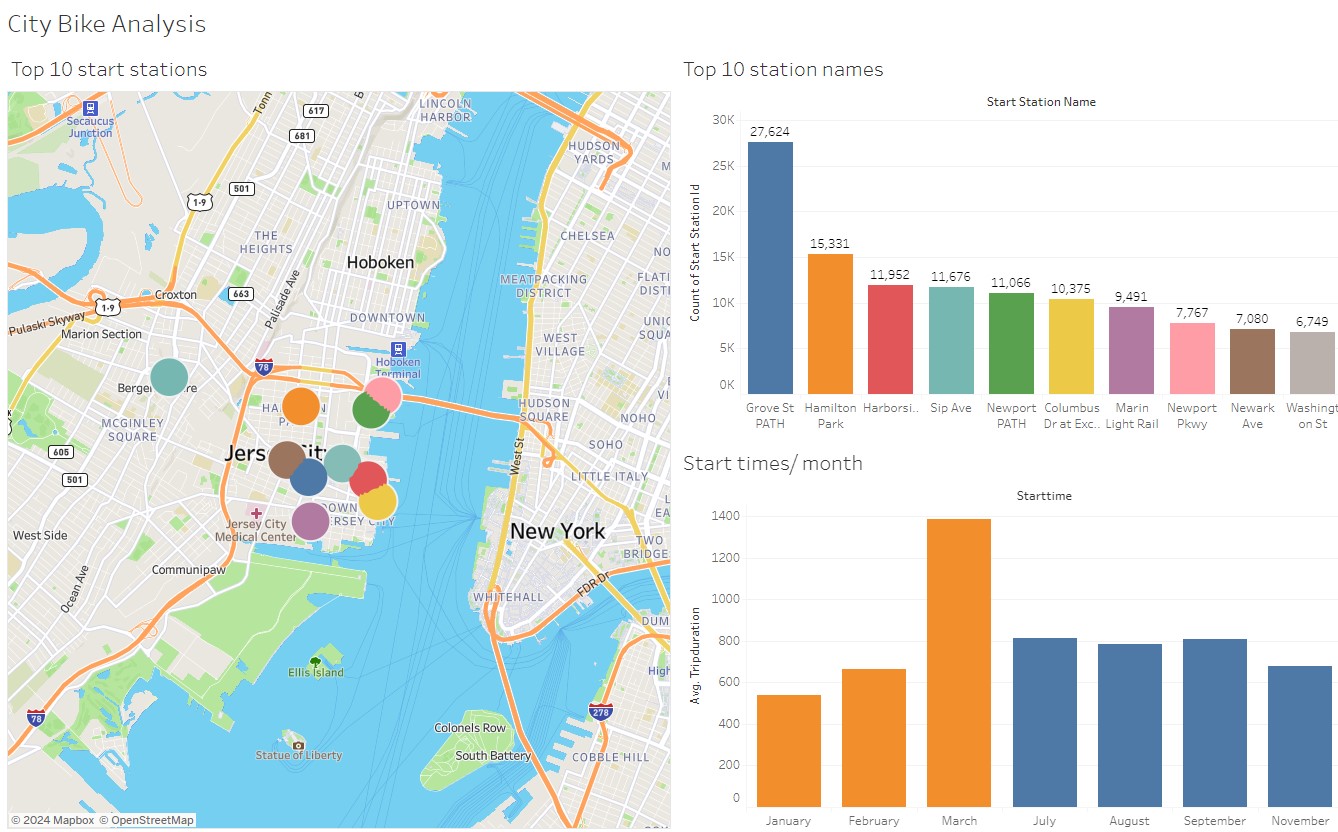
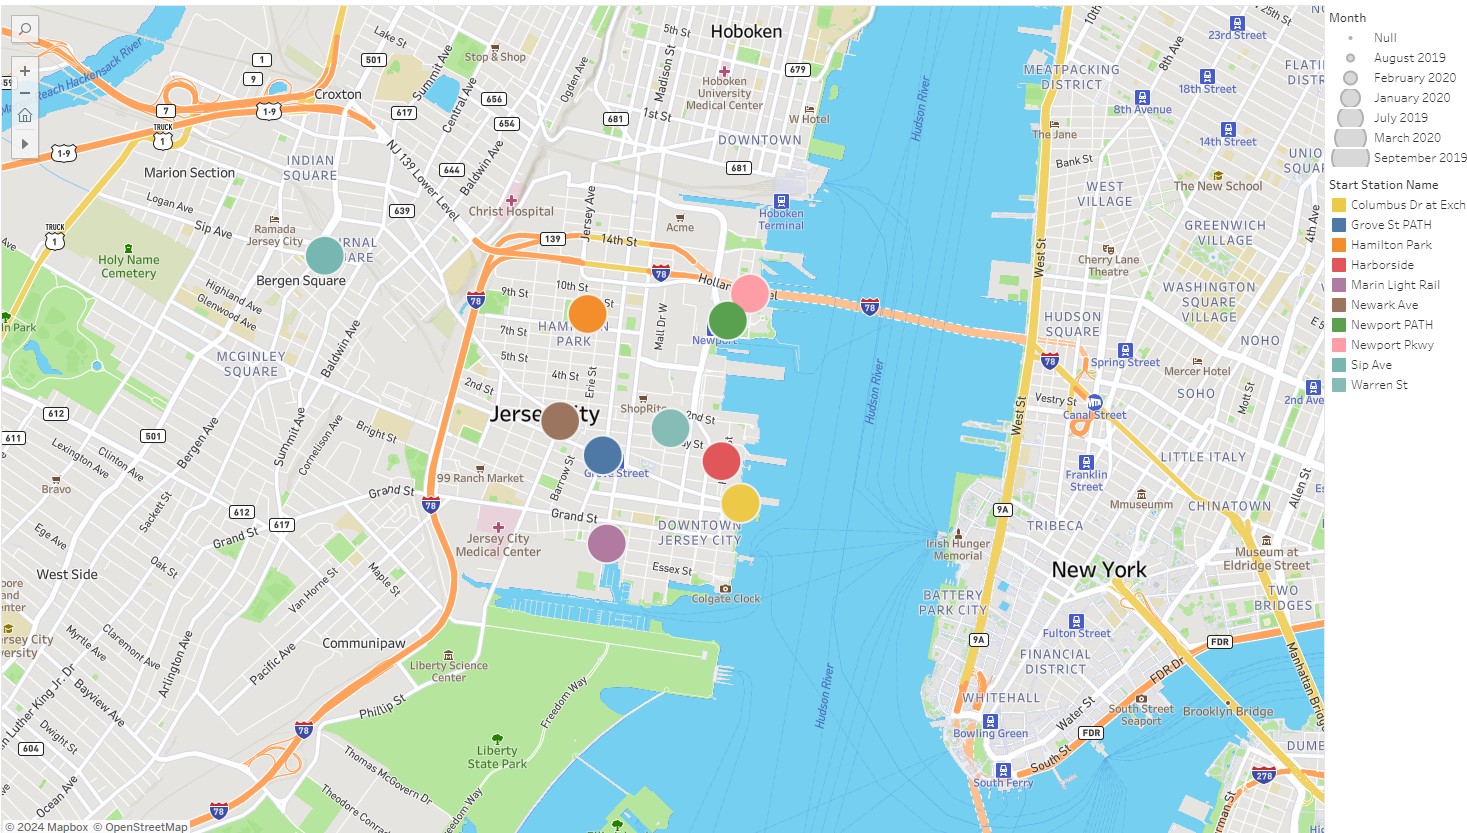
LocationThe top 10 stations were mostly found in jersy city as compared to Hoboken and New York.
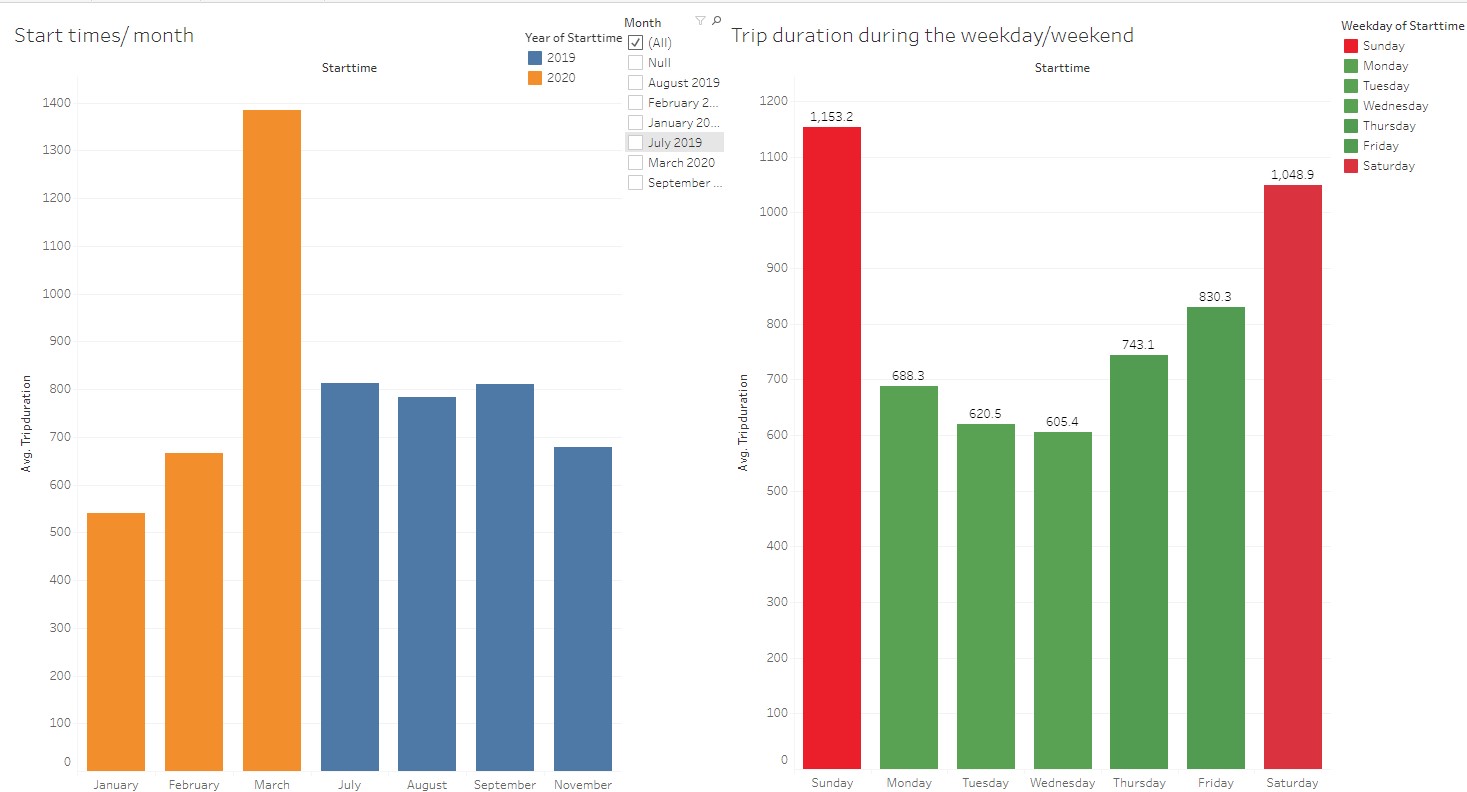
March seems to be the most popular month for bike riding, presumably due to the good weather.
Bike use was consistent during all the days of the week, but an increase in use was noted during the weekend.
Recommendations
- Provide daily/ Monthly/ Annual passes to subscribers.
- Offer discount on family packages during the weekend.
- Identify locaions near famous landmark / popular food joints to improve usage.
- Advertise lower rates for female riders as well as offer group rates.
- Provide cashless transactions for bike rentals.
- Create an app to reserve bikes in advance.
Data Limitations
Data Source:
This was a guided project as part of the UT Bootcamp. Tableau-TutorialContact Me
Location
Austin, Tx
manasishidhaye.com