
Back

Introduction
H&C Inc is a new call center that recently opened in Austin, Texas. I was hired as a Tableau Consultant to analyze their employee KPIs. The KPIs allow stakeholders to monitor progress, identify trends and create an explansion plan for 2024.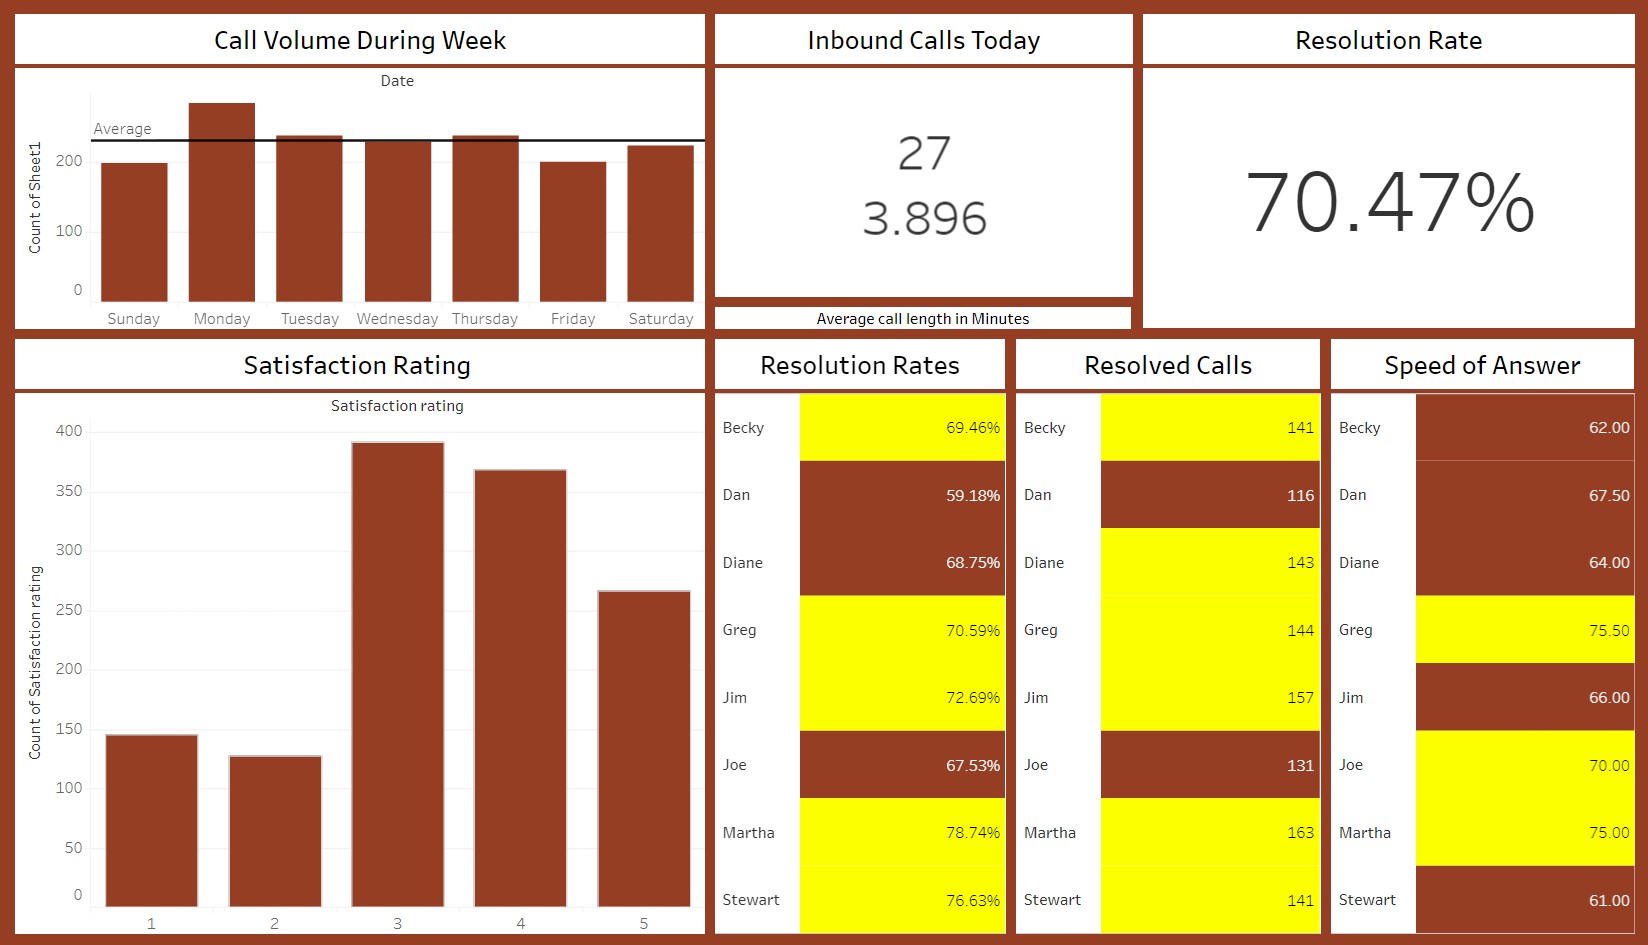
The full interactive Tableau Dashboard can be found Here
Business Questions
- How many calles were resolved?
- How many calls came through a week?
- What is the satisfaction ranking for the calls?
About the Data
8 employees were randomly selected from various departments and their performance was analyzed as per call resolution, customer satisfaction and Speed of answer. About 5000 calls were analyzed on these parameters.
Tools Used
Excel (Data Cleaning)
Tableau (Visualization)
Insights:
- Call volume was always highest on Monday during the week.
- Explored daily inbound calls and the average call length in minutes.
- Number of resolved calls was higher for 2 employees as compared to their peers.
- Bar chart featuring number of calls was very useful to narrow high achievers.
- Resolution rate was more than average for most employees.
- Speed of answer was above 60 %
- Satisfaction rating was measured on the scale of 5.
Recommendations
Employee start times should be staggered during the day to provide maximum coverage.
Offer in person, hybrid and remote options to the employees to retain employees
Data Source:
This was a guided project as part of the Data Analyst Bootcamp.Contact Me
Location
Austin, Tx
manasishidhaye@gmail.com